Bücher versandkostenfrei*100 Tage RückgaberechtAbholung in der Wunschfiliale
15% Rabatt11 auf ausgewählte eReader & tolino Zubehör mit dem Code TOLINO15
Jetzt entdecken
mehr erfahren
Zustellung: Sa, 30.08. - Mi, 03.09.
Versand in 5 Tagen
VersandkostenfreiBestellen & in Filiale abholen:
Get up and running with building data pipelines and creating interactive dashboards to visualize, monitor, and present a wide variety of time-series data with this comprehensive introductory guideKey FeaturesInstall, set up, and configure Grafana for real-time data analysis, visualization, and alerting
Visualize and monitor data using data sources such as InfluxDB, Telegraf, Prometheus, and Elasticsearch
Explore Grafana's cloud support with Microsoft Azure, Amazon CloudWatch, and Google Cloud Monitoring
Purchase of the print or Kindle book includes a free PDF eBook
Book Description
Get ready to unlock the full potential of the open-source Grafana observability platform, ideal for analyzing and monitoring time-series data with this updated second edition. This beginners guide will help you get up to speed with Grafana's latest features for querying, visualizing, and exploring logs and metrics, no matter where they are stored.
Starting with the basics, this book demonstrates how to quickly install and set up a Grafana server using Docker. You'll then be introduced to the main components of the Grafana interface before learning how to analyze and visualize data from sources such as InfluxDB, Telegraf, Prometheus, Logstash, and Elasticsearch. The book extensively covers key panel visualizations in Grafana, including Time Series, Stat, Table, Bar Gauge, and Text, and guides you in using Python to pipeline data, transformations to facilitate analytics, and templating to build dynamic dashboards. Exploring real-time data streaming with Telegraf, Promtail, and Loki, you'll work with observability features like alerting rules and integration with PagerDuty and Slack. As you progress, the book addresses the administrative aspects of Grafana, from configuring users and organizations to implementing user authentication with Okta and LDAP, as well as organizing dashboards into folders, and more.
By the end of this book, you'll have gained all the knowledge you need to start building interactive dashboards.What you will learnLearn the techniques of data visualization using Grafana
Get familiar with the major components of Time series visualization
Explore data transformation operations, query inspector, and time interval settings
Work with advanced dashboard features, such as annotations, variable-based templating, and dashboard linking and sharing
Connect user authentication through Okta, Google, GitHub, and other external providers
Discover Grafana's monitoring support for cloud service infrastructures
Who this book is for
This book is for business intelligence developers, business analysts, data analysts, and anyone interested in performing time-series data analysis and monitoring using Grafana. You'll also find this book useful if you're looking to create and share interactive dashboards or get up to speed with the latest features of Grafana. Although no prior knowledge of Grafana is required, basic knowledge of data visualization and some Python programming experience will help you understand the concepts covered in the book.Table of ContentsIntroducing Data Visualization with Grafana
Touring the Grafana Interface
Diving into Grafana's Time Series Visualization
Connecting Grafana to a Prometheus Data Source
Extracting and Visualizing Data with InfluxDB and Grafana
Shaping Data with Grafana Transformations
Surveying Key Grafana Visualizations
Surveying Additional Grafana Visualizations
Creating Insightful Dashboards
Working with Advanced Dashboard Features and Elasticsearch
(N.B. Please use the Look Inside option to see further chapters)
Produktdetails
Erscheinungsdatum
20. Dezember 2023
Sprache
englisch
Untertitel
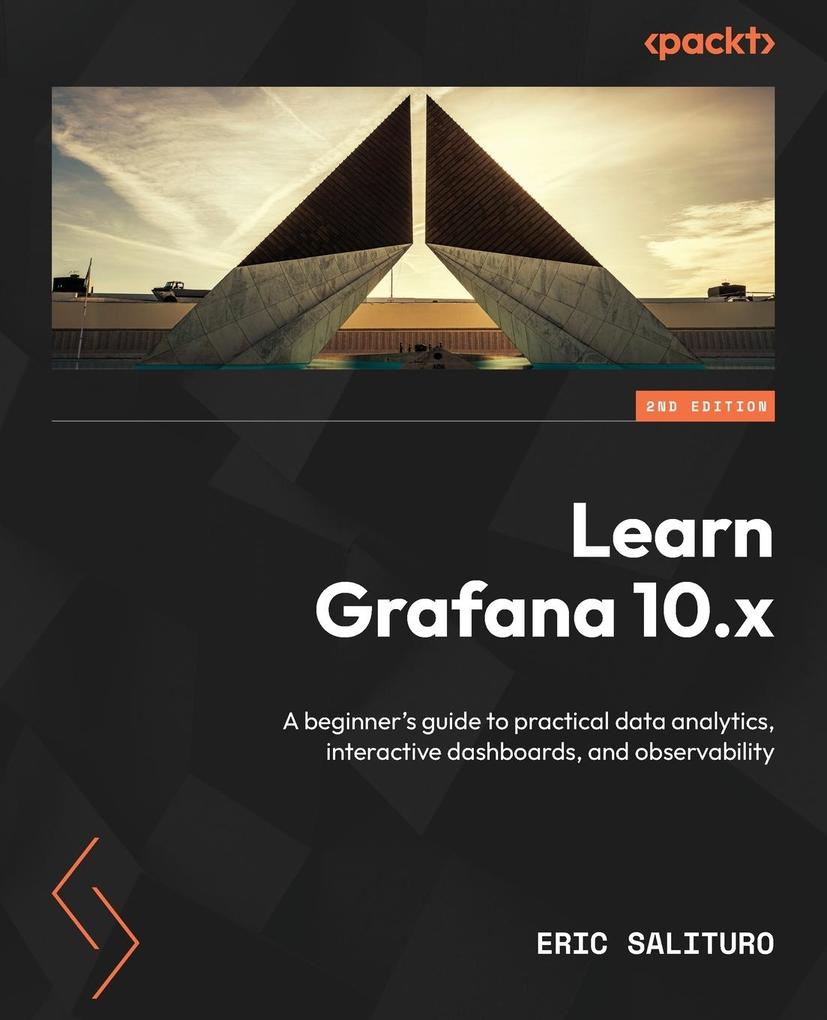
A beginner's guide to practical data analytics, interactive dashboards, and observability.
2. Auflage.
Sprache: Englisch.
Auflage
2. Auflage
Seitenanzahl
542
Autor/Autorin
Eric Salituro
Verlag/Hersteller
Produktart
kartoniert
Gewicht
1000 g
Größe (L/B/H)
235/191/30 mm
ISBN
9781803231082
Entdecken Sie mehr
Bewertungen
0 Bewertungen
Es wurden noch keine Bewertungen abgegeben. Schreiben Sie die erste Bewertung zu "Learn Grafana 10.x - Second Edition" und helfen Sie damit anderen bei der Kaufentscheidung.


