Zustellung: Mi, 16.07. - Sa, 19.07.
Versand in 5 Tagen
VersandkostenfreiBestellen & in Filiale abholen:
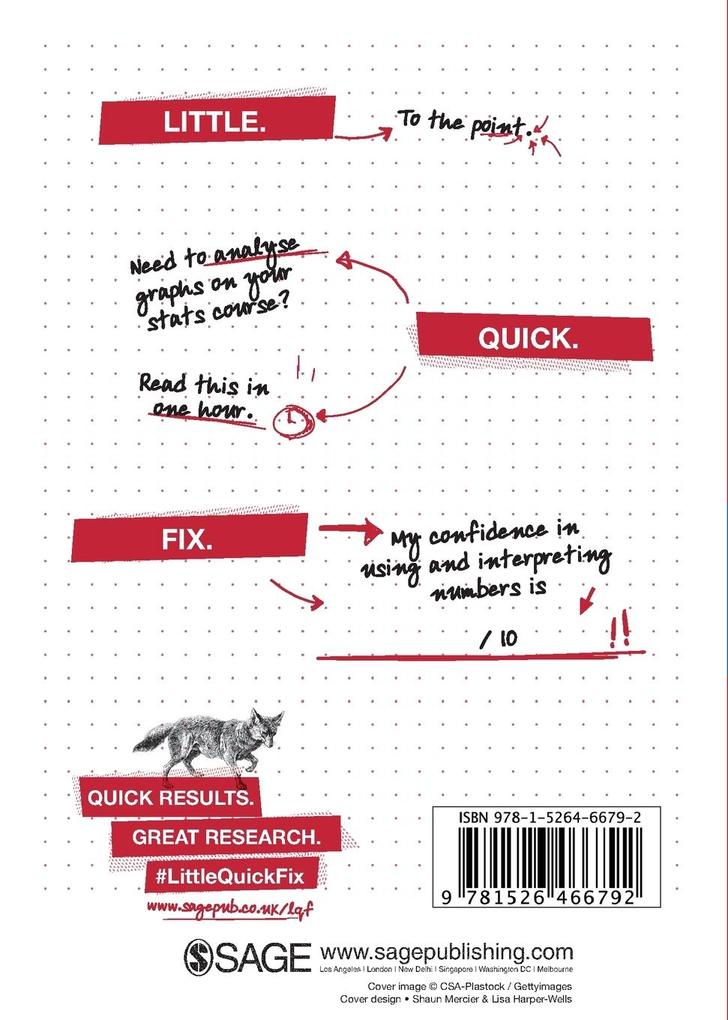
Being able to read and interpret tables and graphs is a skill that is frequently tested and where students often lose marks in tests. This Little Quick Fix prepares students to read, interpret and produce tables and graphs with confidence and succeed in their exams.
Inhaltsverzeichnis
Section 1: Why is most data numerical data?
Section 2: What is the average, level or central tendency of data?
Section 3: What is the spread or dispersion of data?
Section 4: How do I understand the data in a graph?
Section 5: What are the five main kinds of graphs?
Section 6: What is scientific notation?
Section 7: How can I use and interpret numbers in data well?
Mehr aus dieser Reihe
Produktdetails
Erscheinungsdatum
24. Januar 2019
Sprache
englisch
Seitenanzahl
138
Reihe
Little Quick Fix
Autor/Autorin
John Macinnes
Verlag/Hersteller
Produktart
kartoniert
Gewicht
200 g
Größe (L/B/H)
178/127/9 mm
ISBN
9781526466792
Entdecken Sie mehr
Bewertungen
0 Bewertungen
Es wurden noch keine Bewertungen abgegeben. Schreiben Sie die erste Bewertung zu "See Numbers in Data" und helfen Sie damit anderen bei der Kaufentscheidung.


